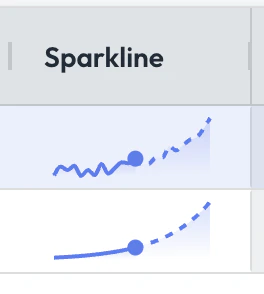
Sparklines are small charts that display in grids to help you quickly visualize how an amount is changing over time. Sparklines always display dynamic amounts - meaning they will show theDocumentation Index
Fetch the complete documentation index at: https://docs.pluvo.io/llms.txt
Use this file to discover all available pages before exploring further.
actual amount for past data (denoted by a solid line), and the forecast amount for future dates.