

Documentation Index
Fetch the complete documentation index at: https://docs.pluvo.io/llms.txt
Use this file to discover all available pages before exploring further.
Part 2:
Building a Balance Sheet The Balance Sheet is one of the three core financial statements and a vital piece of any complete financial model. It shows your company’s financial position at a specific point in time by summarizing your assets, liabilities, and equity. In a fully linked 3-statement model, the balance sheet connects directly to your P&L and Cash Flow Statement—providing structure, accuracy, and integrity to the entire model.What Is the Balance Sheet Used For?
The balance sheet answers questions like:- How much cash do we have right now?
- What do we own, and what do we owe?
- How much runway is left based on current assets and burn?
- Measuring working capital and liquidity
- Evaluating debt/equity structure
- Supporting financial ratios for lenders or investors
Why Does the Balance Sheet “Balance”?
The balance sheet is based on the accounting identity:Assets = Liabilities + Equity
This relationship must always hold true. If your sheet doesn’t balance, there’s likely a mistake in your model logic—making this a critical checkpoint for model accuracy and integrity.
In Pluvo, this means ensuring that every change to assets (like revenue or AR) is offset by corresponding changes in liabilities or equity (like retained earnings).
Setting Up a Balance Sheet in Pluvo
Step 1:
Create a New Model- Click + New Model in the sidebar
- Name it
Balance Sheet - (Optional) Add it to a “Core Statements” folder
Step 2:
Add Core Variables Click + Add Variable and include the following key sections: Assets- Cash
- Accounts Receivable
- Prepaid Expenses
- Fixed Assets
- Total Assets →
=sum(cash, ar, prepaid_expenses, fixed_assets)
- Accounts Payable
- Accrued Expenses
- Deferred Revenue
- Debt
- Total Liabilities →
=sum(ap, accruals, deferred_rev, debt)
- Retained Earnings →
=retained_earnings[last month] + net_income - Paid-in Capital
- Total Equity →
=sum(retained_earnings, paid_in_capital)
=total_liabilities + total_equityThen compare against Total Assets to confirm balance. You should have something that looks like this: [📸 Screenshot: Folder structure + totals logic]
Step 3:
Add Detail (Optional) You can create sub-variables to track breakdowns:- Cash
- Operating Account
- Payroll Account
- Debt
- Short-term
- Long-term
- Fixed Assets
- Equipment
- Leasehold Improvements
Step 4:
Define Actuals Just like with the P&L, define actuals by linking to your accounting system’s GL accounts.- Cash →
Bank Accounts - AR →
Accounts Receivable - Debt →
Loans Payable - Retained Earnings →
Equity > Retained Earnings
Step 5:
Forecast the Balance Sheet Forecasts for the balance sheet are usually driven by logic, not manual values. For example:- Debt →
- Cash → Will be driven by the cash flow statement in Part 3
Step 4:
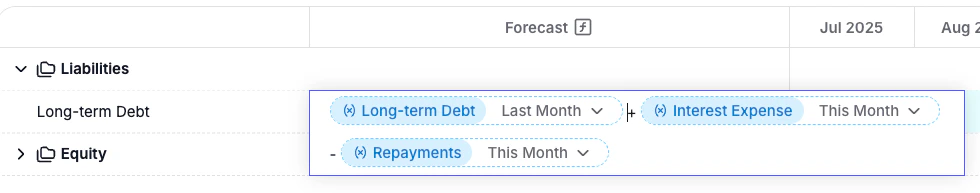
Forecast the Balance Sheet Unlike the P&L, most balance sheet forecasts are cumulative—each month’s value builds on the last. In Pluvo, this is typically modeled as:value_this_month = value_last_month + change
For example, in the case of long term debt:
Step 6:
Check the Balance At the bottom of your balance sheet, add a row:Your balance sheet reflects how your operations (P&L) impact your position over time. Always make sure it balances, and use it as your anchor when building a fully connected model.