

There are two main ways to look at forecast vs actuals in charts.Documentation Index
Fetch the complete documentation index at: https://docs.pluvo.io/llms.txt
Use this file to discover all available pages before exploring further.
- By plotting both the forecast and actuals as separate series
- By plotting variance as its own series
Add
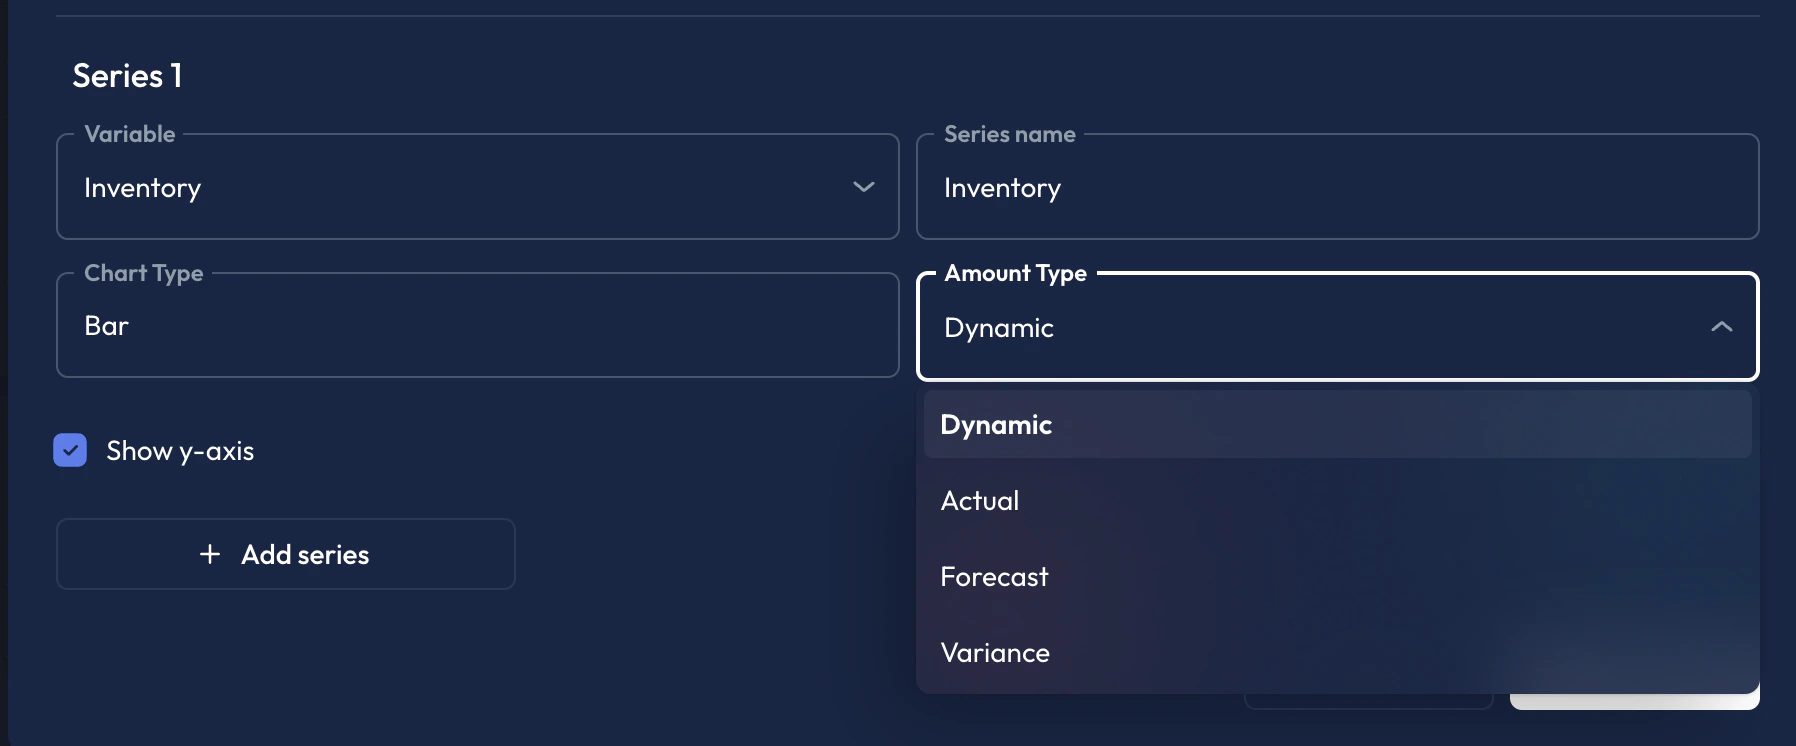
Forecast vs Actuals to a chart Forecasts and actuals can be added to charts as separate series to easily visualize the difference.- Add a new Series
- Select your variable
- Under Amount Type, select
Forecast - Add a second series
- Select the same variable as in Step 2.
- Under Amount Type select
Actual - Click
Save